
Understanding the Target Summary
The Target Summary shows you summary data on the people in your district. This information is pulled from voterfiles. Today, RunningMate supports Civitech’s Source voterfile and TargetSmart’s voterfile.
The first number in the Target Summary is your target population. When you first open RunningMate, this number is the number of known voting-age people in your district. As you apply filters in the Filter Panel, the Target Summary will update to reflect your more focused target population.
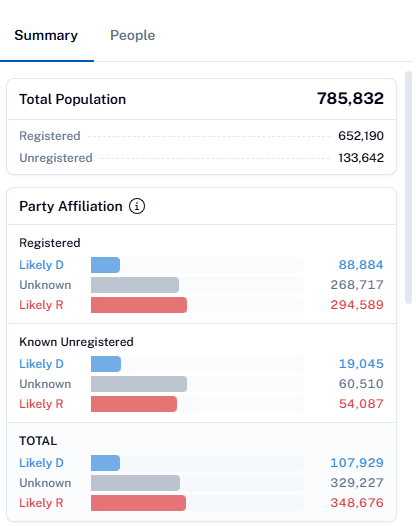
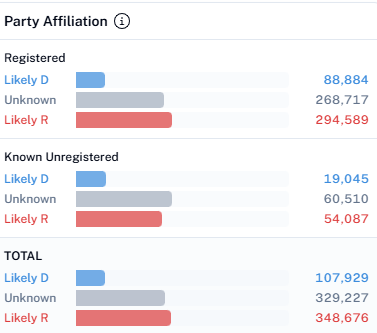
The Party Affiliation table shows you the breakdown of people in your district by party affiliation and registration status:
- Registration:
- People who are registered come from a voterfile.
- People who are unregistered come from other data sources including Civitech’s unregistered voter datasets. Unregistered people in RunningMate only represent the subset of the total unregistered population that is available in the underlying data sources.
- Party affiliation:
- The “Known Dem” and “Known Rep” categories include people whose party leaning is known because your state records party registration as part of voter registration.
- For states without partisan voter registration, Known Dem and Known Rep will be hidden since they aren’t tracked.
- The “Likely Dem” and “Likely Rep” categories include people with a “partisan score” that suggests they lean Democratic or Republican. This partisan score is included in the voterfiles RunningMate uses and is an estimate of someone’s political preference based on data models.
- The “Unknown” category includes people with partisan scores in a middle range where it’s hard to make predictions about their political leaning.
- The “Known Dem” and “Known Rep” categories include people whose party leaning is known because your state records party registration as part of voter registration.
The Voter Turnout Table is designed to help users estimate the number of voters likely to participate in in upcoming election.

The break down voters into three categories:
- Likely Voters are those who have a history of consistently voting in elections.
- Likely Voters are those who have a history of consistently voting in elections.
- Unknown Voters are those for whom we don't have enough information to predict their voting behavior.
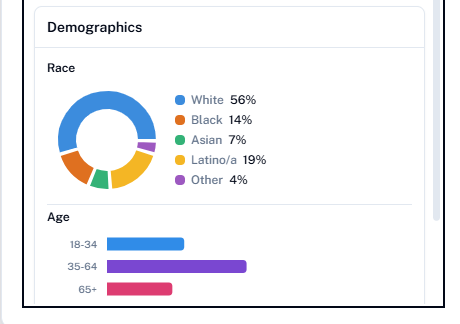
The Demographics table shows you the breakdown of people in your district by race, age, and sex

- Race:
- This section shows the self-reported race of people as part of their voter registration where available (AL, FL, GA, LA, NC, SC). Otherwise, this field shows a modeled guess at a person’s race based on their name, location, and other factors.
- This field uses Census categories for race. Race and ethnicity are much more complex than what these values capture, but they are a lowest common denominator that can map to other data sources.
- Age:
- This section shows estimated age of people from birth dates in voterfiles.
- Sex:
- This section shows sex (referred to as “gender” by some states) of people from voter files.
- This field uses “Male”, “Female”, and “Other” as values for sex since these are the values provided by state voter files. Sex and gender are much more complex than what these values capture, but they are a lowest common denominator that can map to other data sources.